

News
Easily Track All Of Your ClickFunnels Analytics On One Dashboard
11 October 2020
Anna B.

Have you ever dreamt of an analytics dashboard that shows all of your ClickFunnel data in one easy-to-use, beautiful dashboard? 😍
As a marketer, an e-commerce store owner, or any other virtual business owner, we know how important it is to be able to analyze and quantitate what we’re doing online.
Marketers and agencies know especially, if you’re being paid to help someone sell something online and you can’t prove the revenue you’re generating they’ll be saying bye-bye to your services.
We all know ClickFunnels have their own version of analytics, but if you ask me it’s crowded and not easy to instantly understand on the main dashboard and their funnel “stats” are just not hitting the analytical spot.
There are so many tools and websites you can use to analyze, track, and report. The issue here is just that, they’re outside tools and websites. You should be able to see your numbers clearly in the same place that you’re creating them.
Here at Funnelish, data fuels us. So we wanted to make sure we could have our own dashboard that would present clean, cool data in a way that just makes sense.
So what did we do? We made our own analytical dashboard — of course!
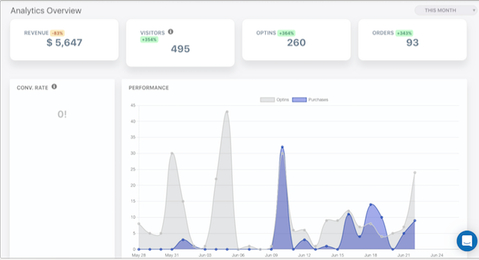

You can see a breakdown of your numbers across your whole account from the Overview tab on your Funnelish account…
Or you can see a breakdown of your individual funnel and review the performance page by page!
We’re so excited about this update and we know it’s going to change the game on reporting.
Get on your Funnelish account and start seeing where the money’s going!
Get involved in the community by joining our Facebook group, checking out our forum, or our Knowledge Base.
Taylor
Table of contents
Boost your eCommerce
sales today

24/7 support
No credit card required
Cancel anytime
24/7 support
No credit card required
Cancel anytime
