

Customer Lifetime Value in Ecommerce: How Much Is One Customer Worth?
19 October 2026
Anna P.
12 minutes
Customer lifetime value is the profit one customer leaves you across the whole relationship. Multiply your average order value by purchase frequency, by how long a customer stays, by gross margin, then take off what you paid to acquire them. That number is the most you can afford to spend winning the next one.
Your order history already holds three of those four numbers. The fourth, how long a customer stays, gets guessed at, and the usual guess is wrong. Here's what to use instead, and what the numbers look like across 64 million orders.
TL;DR
The formula: average order value × purchase frequency × customer lifespan × gross margin, then subtract acquisition cost for the net figure.
Three textbook formulas disagree. Which one fits depends on whether you count the customer's first payment, and whether cash books at the start or the end of each period.
Don't estimate lifespan as 1/churn. Retention climbs as a cohort ages, and the shortcut misstates it in both directions. Chart your own month-by-month cohort curve instead.
Benchmarks from 64 million orders: the median US order is $29.97, the median order session $71.57, and 21.6% of buyers accept a post-purchase upsell. (Funnelish Internal Data)
Fastest gains: a post-purchase upsell, bundles that raise the first order, and recovering renewals lost to declined payments.
What Is Customer Lifetime Value?
Customer lifetime value, or CLV, is the net profit a business expects from a single customer over the entire relationship. Some teams write it LTV, and they're both pointing at the same number.
It differs from revenue in two ways:
You subtract cost of goods and shipping first, because CLV measures profit instead of revenue.
The number points forward, because you're predicting what a customer will be worth instead of totalling what they've already spent.
Add up what a customer has already spent and you get historical CLV, a different question with a different use. Keep the two apart, because you spend acquisition budget against the forward number. If a customer's worth $90 in profit and costs $70 to acquire, you buy as many as you can find.
Customer Lifetime Value Formula and How to Calculate It
Start with the version you can run on your own data:
CLV = average order value × purchase frequency × customer lifespan × gross marginYou need four numbers, and three of them are already in your order data.
Average order value. Total revenue divided by number of orders, over a set period. Twelve months is a sensible default.
Purchase frequency. Total orders divided by unique customers over the same period. Ten thousand orders from 6,000 customers gives a frequency of 1.67.
Gross margin. Revenue minus cost of goods, as a percentage. Leave out fixed costs. CLV gets compared against acquisition cost, and overhead makes that comparison useless.
Customer lifespan. Nothing in your data tells you this, and if you get it wrong the whole answer's wrong.
Multiply the four for gross CLV. A $72 average order, 2.4 orders a year, a two-year lifespan and a 60% margin works out at $72 × 2.4 × 2 × 0.6 = $207 per customer. Subtract acquisition cost from that for the net figure, because that's what tells you whether the business works.
Three Textbooks Give Three Different Answers
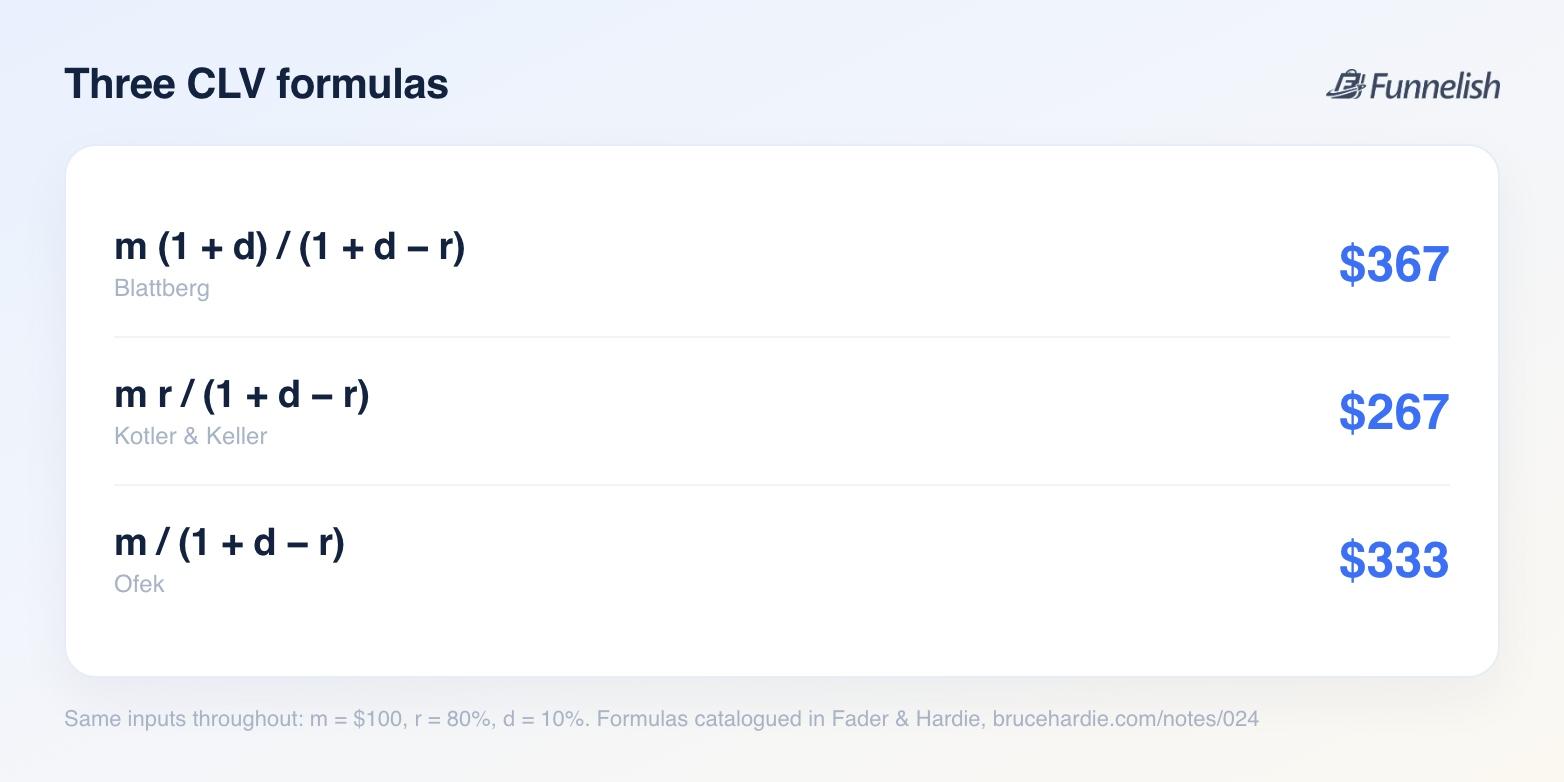
Academic versions add a discount rate, and they disagree with each other. Open three marketing textbooks and you'll get three of them, all using the same three numbers: margin per period (m), retention rate (r), and discount rate (d).
CLV = m × (1 + d) / (1 + d − r)CLV = m × r / (1 + d − r)
CLV = m / (1 + d − r)
Peter Fader and Bruce Hardie catalogued this in a note on CLV formulas, and the three resulting versions are far apart. Put in $100 margin, 80% retention and a 10% discount rate and you get $367, $267 and $333.
Answer two questions and you'll know which to use.
Does the calculation include the customer's first payment?
Do you count each period's money at the start or the end of that period?
Comparing your CLV against somebody else's doesn't mean much until you know which version they used.
Customer Lifespan: Where CLV Calculations Break
Divide one by your churn rate and you've got a lifespan: a 7.2% monthly churn turns into 13.9 months.
That example isn't hypothetical. Netflix published those exact figures in an 8-K filing, and Peloton used the same calculation in its IPO prospectus and again in a 2019 investor presentation. Fader and Hardie cite both in a July 2026 note on customer lifetime with a blunt conclusion: it is incorrect to say average customer lifetime equals 1/churn rate.
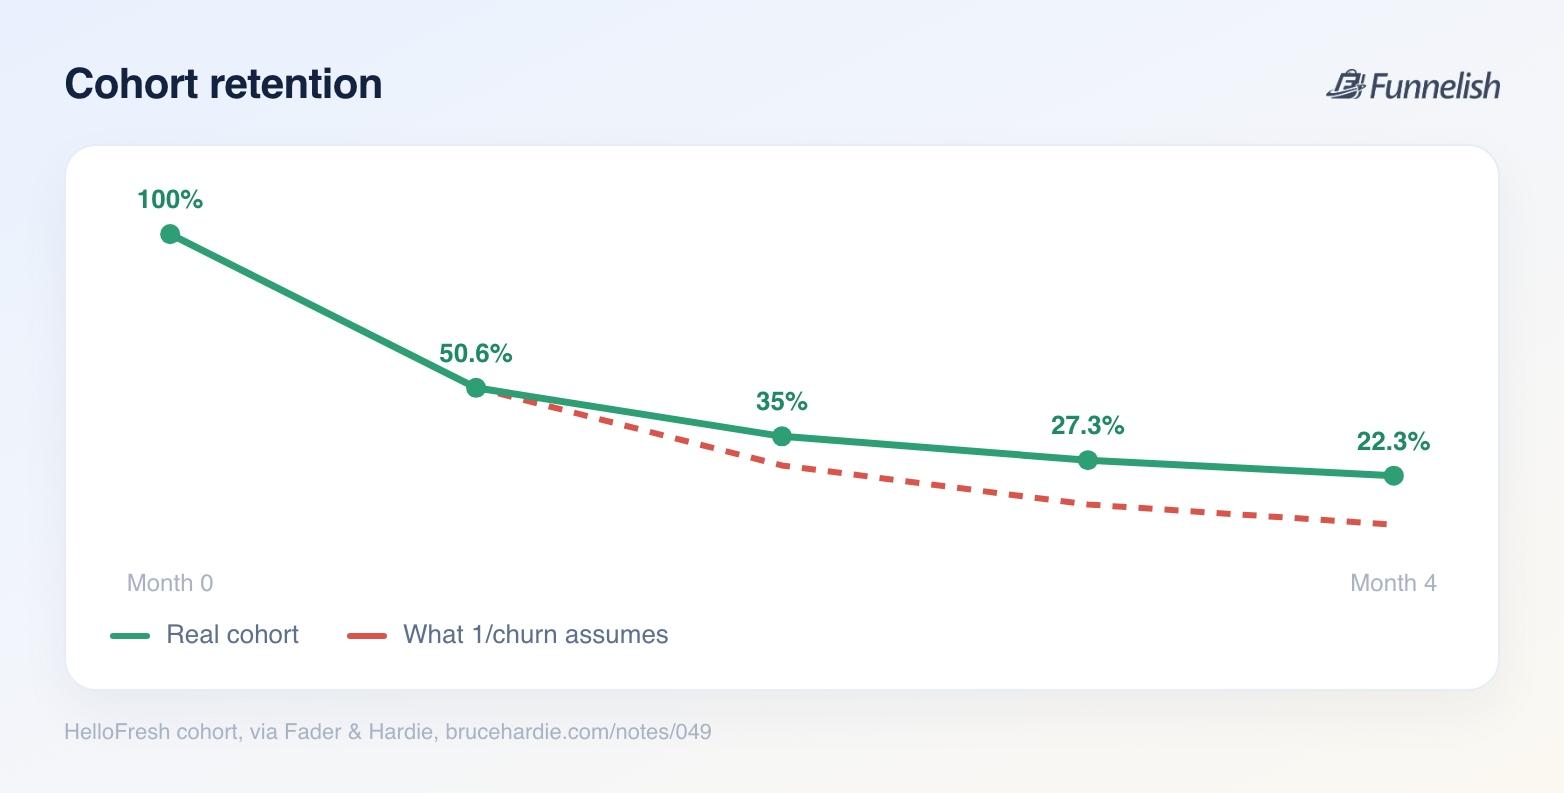
Dividing by churn assumes every customer has the same chance of leaving in every period, forever, and real cohorts don't work like that. Because the least committed leave first, by month six you're down to people who were going to stay anyway, and they churn far more slowly than whoever quit in month one.
HelloFresh cohort data makes it obvious. Of every 100 customers acquired, 50.6 are still there after one month, 35.0 after two, 27.3 after three, 22.3 after four. Month to month, retention runs 51%, then 69%, then 78%, then 82%. It climbs. A constant-churn model can't produce that shape, and any lifespan it predicts will be wrong.
Their guidance: don't compute average customer lifetime as 1/churn rate unless you've shown that the geometric distribution fits and forecasts your own cohort survival curves. If someone hands you a CLV built on 1/churn without that evidence, ignore the number.
Fixing it doesn't take a statistics team. Pull your own cohorts month by month and look at the real curve, because your analytics already knows what share of January's customers came back in February, March and April. Chart it and you have your own lifespan instead of somebody else's average.
Is There an Average Customer Lifetime Value in Ecommerce?
No. Published customer lifetime value ecommerce benchmarks aren't worth much, and neither are the customer lifetime value retail ones, because the number varies tenfold between a $12 supplement refill and a $900 mattress.
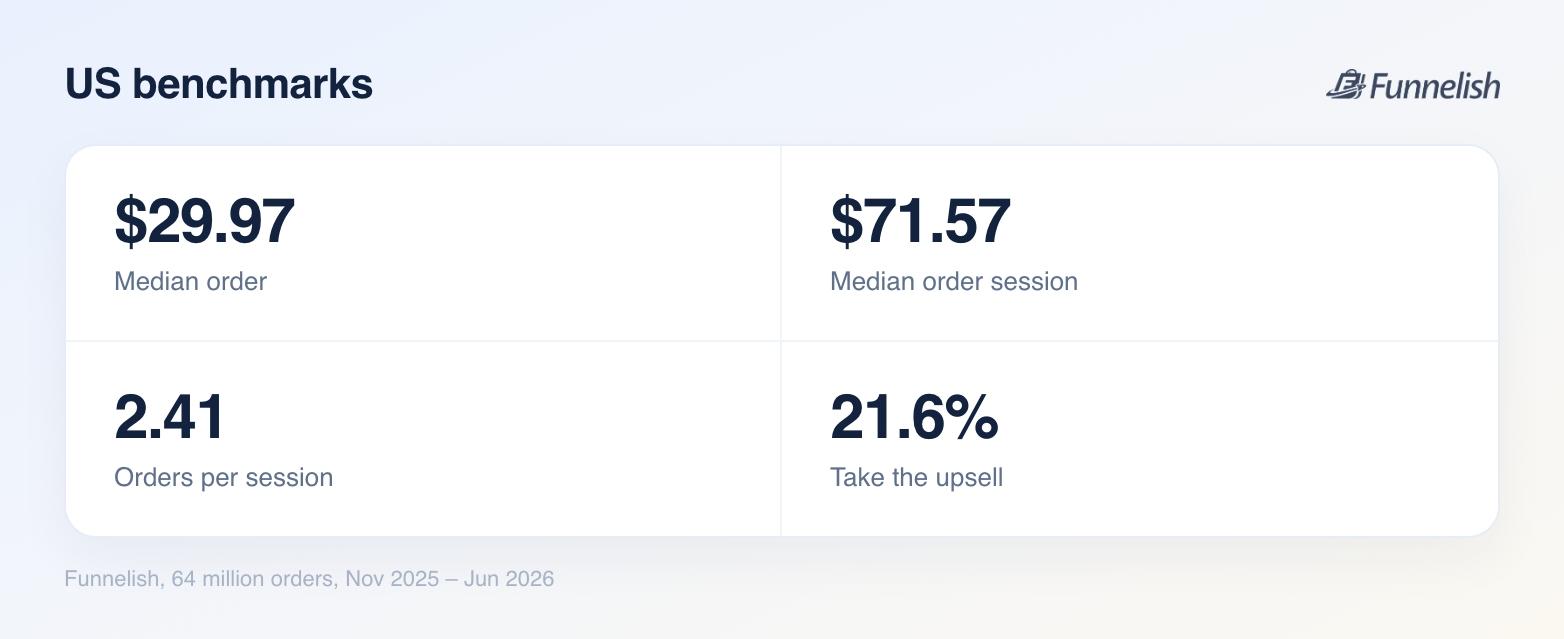
First-order size varies far less, and every repeat purchase multiplies it. Funnelish checkout data covers 4.4 billion events and 64 million orders from 11,930 brands since 2022, $2.08 billion in sales across 73 currencies. For US and Canadian shoppers between November 2025 and June 2026:
The median order is $29.97
The median order session totals $71.57, because shoppers place 2.41 orders in one session once upsells are counted
The top 10% of order sessions total $183 or more
None of those figures is a lifetime value. Checkout data stops at the purchase and doesn't follow a customer across months. For a lifetime number you need your own cohort curve and the four numbers above.
What Factors Impact Customer Lifetime Value?
CLV is built from four numbers, and because they multiply instead of adding up, a 20% gain on each one roughly doubles the total.
Order value. You can change this one inside a quarter. Top-decile brands reach $122.33 a session where the median brand gets $71.57, and they do it with product mix, bundles and post-purchase offers. Pricing power hasn't got much to do with it.
Purchase frequency. Driven by category, and by how hard you make reordering. Consumables have it built in. Everything else has to work for it.
Lifespan. Driven by product quality, service, and whether the customer still remembers you in month four.
Margin. This one multiplies the other three. Discounting cuts CLV twice over: once on the order, and again when it trains people to wait for the next sale.
Which Metrics Predict Customer Lifetime Value?
Three signals do most of the work here, and they're the basis of RFM and the CLV models built on it.
Recency. How long since the last order. The strongest of the three in the RFM literature, and it goes out of date fastest.
Frequency. How many orders to date. Someone on order three is far likelier to place order four than a first-timer's to place order two.
Monetary value. How much they've spent. The weakest of the three on its own, but it picks out the top decile clearly.
Outside RFM, first-order source is worth splitting out, because a customer who arrived on a discount behaves differently later from one who paid full price. Payment method on file matters far more than it should, and here's why.
Failed Payments Cut Your CLV
A subscription renewal declines, the retry fails too, and the relationship ends there. Your data files it under churn instead of payments.
Across Funnelish accounts, the median Stripe account gets 92.9% of payment-attempt sessions paid, with the middle half between 88.6% and 95.7%. Stripe in the US pays out on 94.0% of sessions. On high-risk gateways the middle half of accounts runs from 69% to 88%. Two stores selling the same thing can be 19 points apart on how often the money arrives.
Payment routing recovers some of that money by sending a declined charge to a second gateway instead of letting it fail. On a subscription business, a recovered renewal is a recovered customer, and you keep earning from them for as long as they stay.
How to Increase Customer Lifetime Value
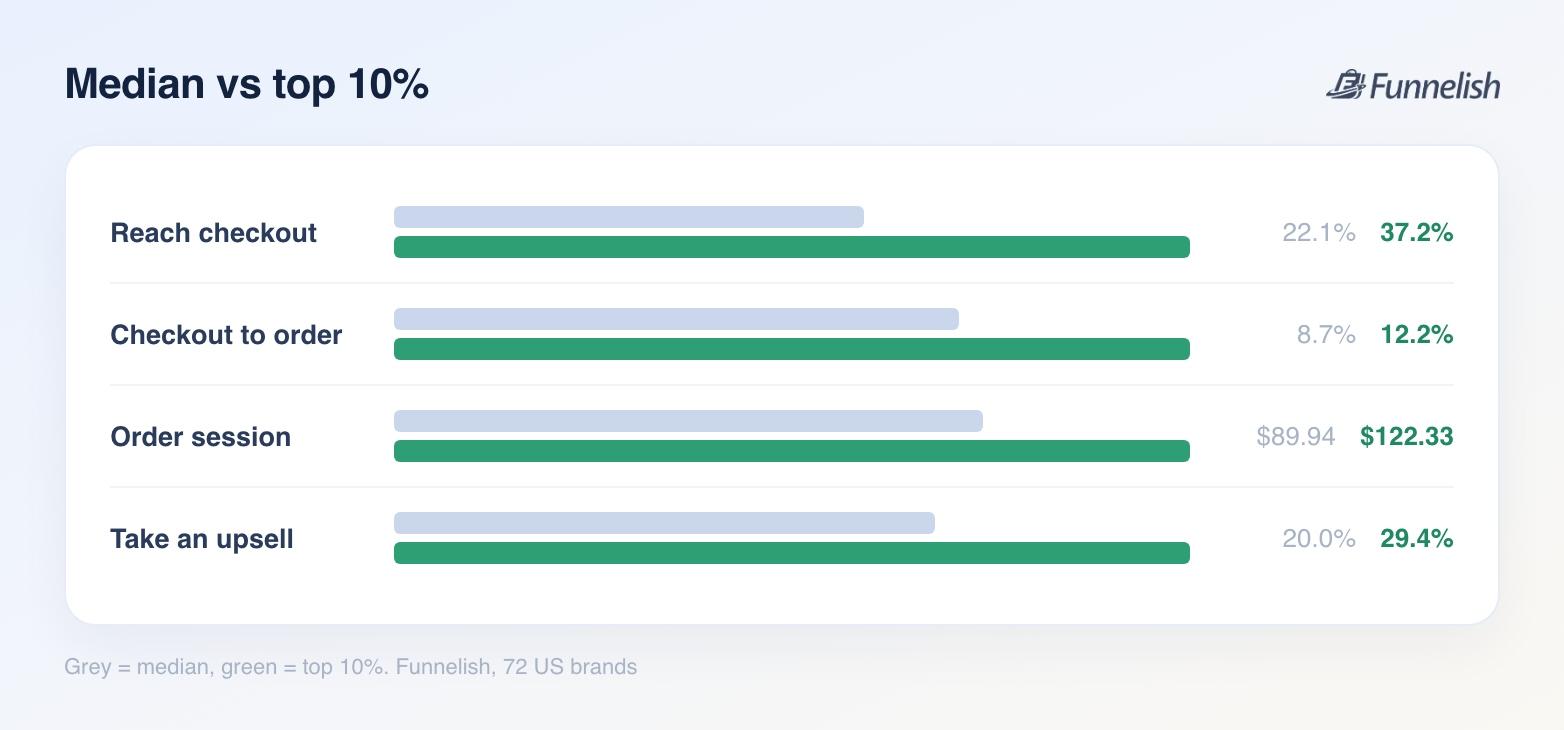
Raise what a customer's worth and you boost profits without buying a single extra click. The top decile of US brands in the benchmark aren't the biggest. They buy the same traffic, on the same devices, with the same payment approval rates, and they're ahead on four numbers at once. 37.2% of visitors reach checkout against 22.1%, and they close 12.2% of those against 8.7%. Their order session is $122.33 against $89.94, and 29.4% of buyers take an upsell against 20.0%.
Put a post-purchase upsell after every order. 21.6% of US buyers accept one, and it adds 18% to the order session. The best quartile of funnels gets 30% of buyers to accept, and adds 33%. The offer runs after payment, and it can't cost you the original sale. Our guide to upsell techniques covers the offer design.
Make the second order easy to place. Plenty of stores spend everything on acquisition and then leave reordering to a marketing email. Give customers a login where order history, tracking and subscriptions live in one place, and the second purchase stops depending on whether they opened your campaign.
Turn repeat purchases into subscriptions where the product allows. A subscription turns an uncertain lifespan into a scheduled one. A scheduled renewal date does more for a CLV estimate than any model will. Think consumables, refills, anything that runs out. We've written up the subscription mechanics separately.
Raise the first order instead of discounting it. Bundles, quantity breaks and order bumps all raise the first order, and every repeat multiplies it. Start with product bundles, where one choice replaces several.
Recover the orders you already won. Half of US buyers decide in under 6.4 minutes, and of every 100 who reach a checkout page, 90 leave before pressing Pay. Fixing that page pays better than finding new traffic. Anyone who still leaves gets an abandoned cart sequence.
Segment by predicted value instead of last click. Treat a third-time buyer differently from a first-timer. Personalization at the offer level beats personalization at the banner level.
Shopify Customer Lifetime Value Reporting
For customer lifetime value Shopify includes a predicted spend tier in its customer reports, its own forecast of what a customer is likely to spend next. It needs more than 100 sales before it turns on, and it only scores people who've already bought. It's still a prediction, with the same caveats as any model you didn't build.
Customer Lifetime Value Software
Customer lifetime value software ranges from simple cohort dashboards up to the probabilistic models used in serious customer lifetime value modelling. Plenty of it gets sold as customer lifetime value maximization, a label that tends to mean dashboards plus email.
The models worth using: BG/NBD if customers buy whenever they like, beta-geometric if they're on a subscription you can watch them cancel. Any real customer lifetime value prediction uses something in that family, once you have enough data to fit one. On a small customer base, though, you'll get more from reading your own cohort curves than from any model. A few thousand customers won't give a model enough to beat a chart.
Whatever you use, check it reports order value, purchase frequency and cohort retention separately. A single CLV number with no breakdown gives you nowhere to start. Funnelish analytics breaks out revenue, order value, conversion rate and earnings per click, covering the funnel side of the calculation.
Customer Lifetime Value FAQ
What is customer lifetime value?
The net profit a business expects from one customer across the whole relationship. It counts profit instead of revenue, and it looks forward instead of summing past orders.
What's the customer lifetime value formula?
Use average order value × purchase frequency × customer lifespan × gross margin. Academic versions add a discount rate, and three competing ones appear in standard textbooks.
How do I calculate CLV for an ecommerce store?
Take twelve months of orders. Divide revenue by orders for average order value, orders by unique customers for frequency, then multiply by gross margin and expected lifespan. Subtract acquisition cost for net CLV.
What's a good customer lifetime value?
Compare it against acquisition cost. Below 1:1 you're losing money on every customer. Above that, the honest answer is it depends on your payback period and how fast you want to grow. The ratio matters more than the absolute number, and the absolute number varies enormously by category.
Why is 1/churn rate wrong for customer lifespan?
It assumes every customer has an identical, constant chance of leaving. Cohorts retain better as they age, and the shortcut misstates lifespan in either direction depending on the curve.
What's the average customer lifetime value in ecommerce?
There isn't a usable one, because categories differ too much. Start from first-order numbers instead: a $71.57 median order session in the US, and $122.33 for the top decile of brands.
How do I improve ecommerce customer lifetime value?
Raise order value with an upsell or a bundle, make reordering easy, and stop losing renewals to failed payments. Those three change fastest.
What is customer lifetime value modelling?
Fitting a statistical model to your order history, then using it to forecast repeat buying instead of assuming a flat churn rate. BG/NBD and beta-geometric are the standard starting points.
What's the fastest way to enhance customer lifetime value?
A post-purchase upsell. 21.6% of US buyers take one, and it adds 18% to the order, on traffic you've already paid for.
How quickly can I raise CLV?
Order value changes fastest, inside weeks, through upsells and bundles. Frequency and lifespan take quarters, because they need repeat behavior to show up in the data.
Where to Start with Customer Lifetime Value (CLV)
Pull one cohort and look at it. Take everyone who first bought in a single month last year, then chart what share came back in each month since. That curve answers the lifespan question for your store, and no published average can.
Then work on the first order. Every repeat multiplies it, and you can change it this week. A post-purchase upsell, a bundle, and a checkout that doesn't lose 90 of every 100 visitors will raise CLV before any retention program has produced a single data point. You can build all three in the Funnelish funnel builder and see which one pays off first.
Table of contents
Boost your eCommerce
sales today

24/7 support
No credit card required
Cancel anytime
24/7 support
No credit card required
Cancel anytime
